我们知道线程会占用内存和 CPU 调度资源,发生泄露时,程序内存会升高,运行效率也会因为过多的线程切换(context switch)而降低,一般上千个线程就会导致性能明显下降。既然 goroutine 被称为“轻量级线程”,那在泄露数量高了几个数量级后,是不是也会导致类似的问题呢?最近我刚好在生产环境遇到了这个问题。
怎么发现的
我司有一个 Go 后台服务,在运行几周后内存占用很高,即使在没有用户使用的闲置时段,它也仍然会占用大约 3G 的内存。另外,我们发现每天闲置时段内存占用都比前一天更高些,这是典型的内存泄漏现象。
用 pprof 分析内存泄露
如果没有标题剧透,我们排查内存泄露问题跟排查普通 BUG 一样,需要信息,而不是浪费时间猜测。 Go 官方提供了pprof工具,可以用来了解 CPU/内存/Goroutine 等使用情况(这里省略工具的具体使用方法)。
我们用 pprof 分析下面简化后的 BUG 代码1:
func calculate(multiple int) (int, error) {
	var res int
	var obErr error
	ctx, cancel := context.WithCancel(context.TODO())
	<-asyncFetch(ctx).Map(func(_ context.Context, i interface{}) (interface{}, error) {
		return multiple * i.(int), nil
	}).ForEach(func(i interface{}) {
		res += i.(int)
	}, func(err error) {
		obErr = err
		cancel()
	}, func() {
		// BUG: should always call cancel()
	}, rxgo.WithContext(ctx))
	return res, obErr
}

func asyncFetch(ctx context.Context) rxgo.Observable {
	ch := make(chan rxgo.Item)
	go func() {
		defer close(ch)
		values := []int{1, 2, 3, 4, 5}
		for _, v := range values {
			rxgo.Of(v).SendContext(ctx, ch)
		}
	}()
	return rxgo.FromChannel(ch, rxgo.WithContext(ctx))
}
分析内存使用
pprof 可以生成“内存占用”的火焰图2:
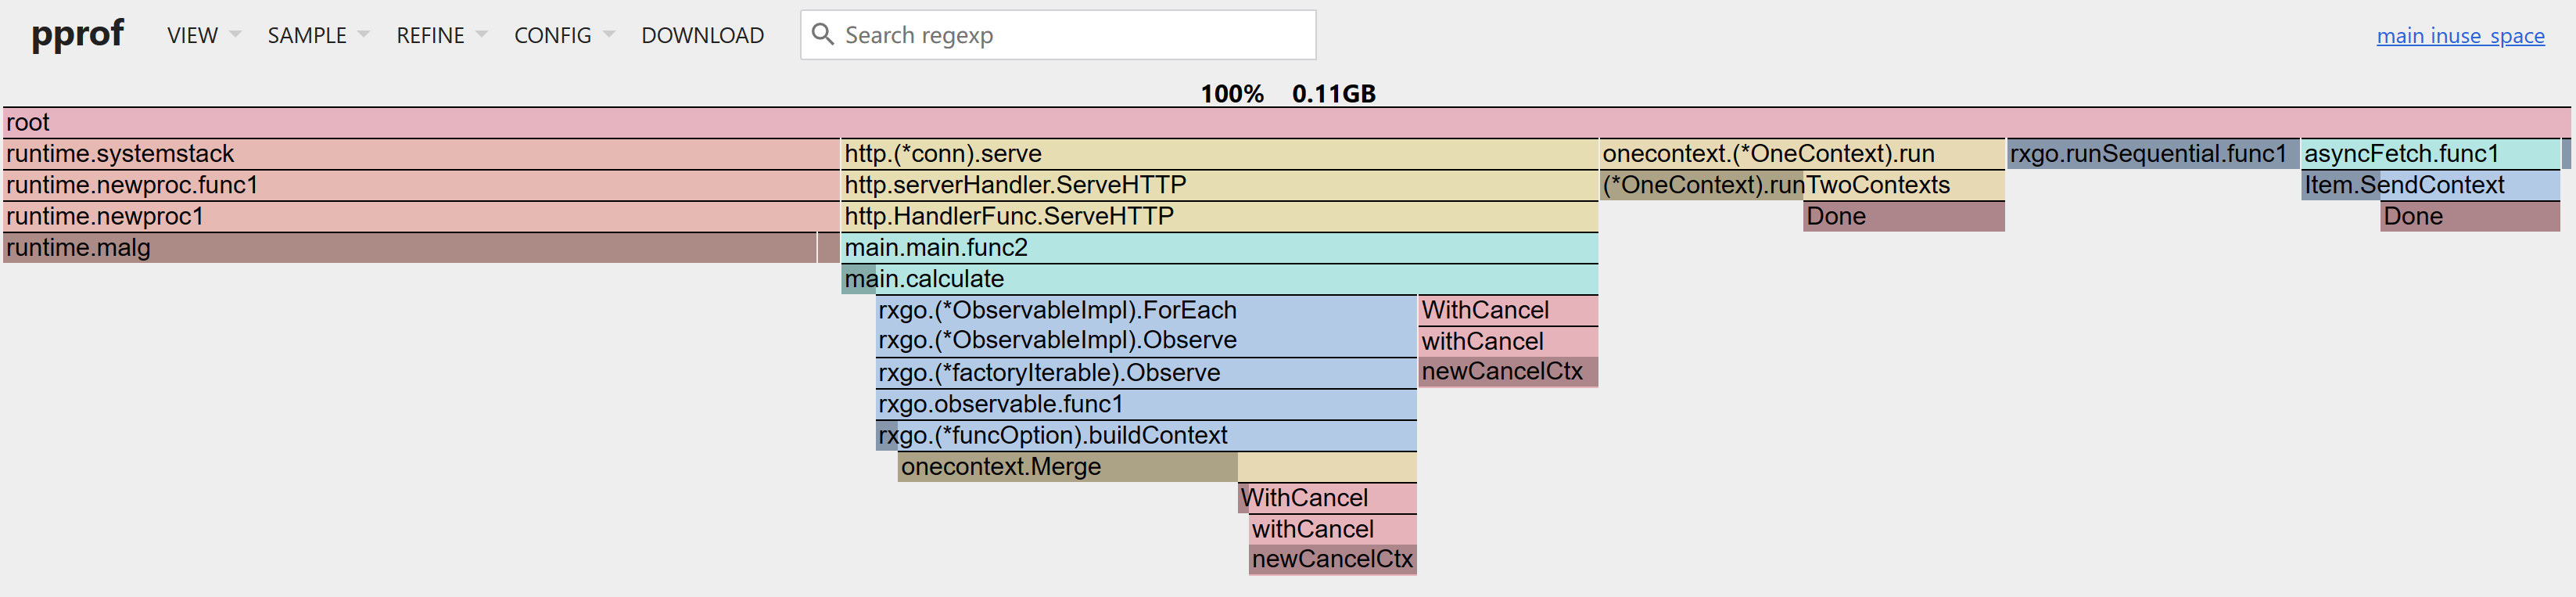
火焰图的宽度是使用资源的比例,可以看到,runtime.malg这个函数占用了很多内存,它是用来创建 goroutine 的,正常情况下它不应该占用很多内存,这种表现说明服务有大量的 goroutine 在运行,而且都没有退出,大概率是 goroutine 泄漏了。
分析 Goroutine 状态
大多数程序的火焰图会充满许多细窄的调用栈,你只靠内存火焰图很难分析出是哪里泄露了 goroutine,所以我们来进一步分析 goroutine 的火焰图:
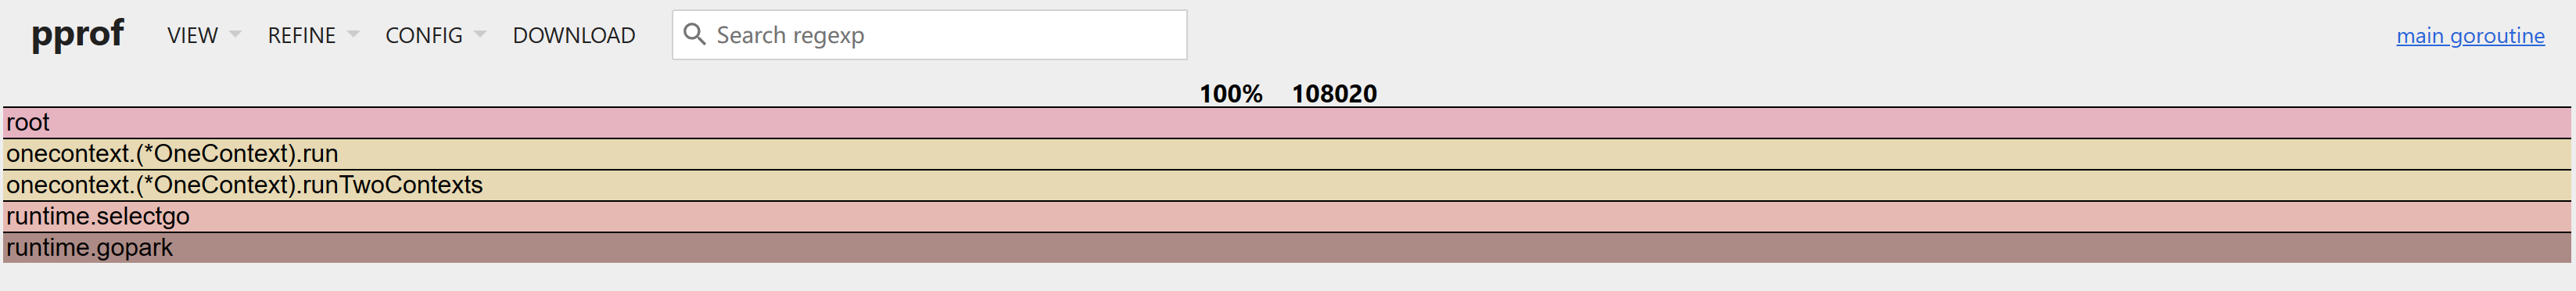
非常明显,onecontext.(*OneContext).run创建了大量的 goroutine,而且都没有退出,这就是我们要找的泄漏点。
总结
泄露 100 万个 goroutine 只增加了一些内存占用,因为大多数情况下泄露的 goroutine 都在等待,没有增加调度的压力,也算对得起“轻量级线程”这个名字。